INITIATIVES OF DATA ANALYTICS GROUP IN AN OFFICE
By Shri R. Ambalavanan, Accountant General
Introduction
1. The Office of the Accountant General (General & Social Sector Audit), Odisha is a pioneer in using data analytics methods for improving the efficiency of audit processes while conducting Compliance, Performance, Thematic and Information Technology (IT) Audits since July 2016 and it used data analytics to support all the processes of auditing like planning, sampling, guidance to field parties, extrapolation, analysis and reporting etc.
2. Keeping in line with the increased thrust on e-governance across the country, the Government of Odisha (GoO) took initiatives to computerise its departments since 2000 and many departments have developed their own software applications like Odisha Secretariat Workflow Automation System (OSWAS), Integrated Financial Management System(IFMS), Works and Accounts Management Information System(WAMIS), e-Sishu etc. to cater to their needs. In addition, the Management Information Systems of Government of India (GoI) are also used by many departments for reporting. These initiatives of GoO created new challenges for the audit office and therefore data analytics techniques has become absolute necessity for enabling a focused audit to minimise the risk of audit failure.
Role of Big Data Analytics
3. Big data analytics improves the financial risk assessment process by discovering red flags, outliers, abnormal behaviour and provides appropriate audit focus areas. It facilitates predictive analysis and use of advanced statistics for transformation of data into actionable information. It thus, contributes to greater level of assurance in audit processes by ensuring proper assessment of financial risks of the Audit units while preparing the Annual Audit Plan, providing focus areas for examinations during ongoing audits and facilitating extrapolation of the audit findings to arrive at the impact on a macro level. The processes involved in big data analytics are as follows:
4. Collection & Analysis of data: Collection & Analysis of data: The Data Analytics (DA) group collects data in various forms from both internal and external sources. The picture depicts the various sources of data which are accessible to audit. The internal data sources are Voucher Level Compilation (VLC), performance data collected by audit parties in a structured forms and Inspection Reports (IRs). The external data sources are Government departments, Public Portal of Government agencies and other statutory organisation. The collected dump data is exported to an appropriate auditing tool like Tableau, Qlickview, Structured Query Language (SQL) etc. Various statistical and exception analysis are carried out in order to examine the specific audit objectives. 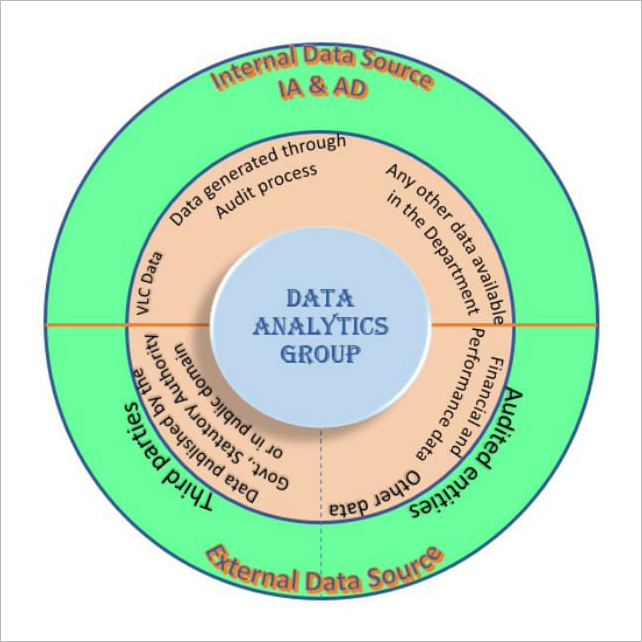
5. Identification of risk areas: Based on the analysis of data on different audit parameters, the risk areas are identified in order to facilitate selection of Audit units while preparing the Annual Audit Plan (AAP), sampling of implementing units while preparing the quarterly audit programme and identification of focus areas while conducting audit. However, the results of data analytics needs validation by field verification to have appropriate audit conclusion. Focussed approach using the risk based audit methodology would provide optimum utilisation of available manpower and improve audit coverage in an efficient manner.
6. Assisting the ongoing audits:
The information generated using data analytics are supplied to the field parties with focus areas for verification at the sampled units. The findings in the sampled units could be extrapolated to 100 per cent transactions of the Audit unit in order to get a broad picture of the transactions of the entire department in the State. Adoption of Geographic Information System (GIS) for audit analysis would also provide the spatial dimension to the audit findings through which distribution of scheme funds, deficiencies noticed, best practices adopted and regional imbalances in execution of schemes in the state could easily be assessed and appreciated. The validated audit information along with the evidences will be used for preparing the Audit Reports.
Initiatives of Data Analytics Group
7. The group initiated various measures to collect, analyse and provide valuable inputs to the audit parties and monitors the outcome. By doing so, the group acts as a knowledge centre for the audit office. The initiatives taken are as follows:
8. VLC-BI Model: Voucher Level Compilation (VLC) data received from the treasuries of the GoO is managed by the office of the Accountant General (A&E) and is readily available for audit utility which provides the compiled expenditure figures submitted by each and every Drawing and Disbursing Officer (DDO). The office of the A.G (A&E) generates monthly civil accounts, prepares Finance and Appropriation accounts for the State by regularly reconciling the voucher level accounting figures received from treasuries with the departmental figures.
9. The VLC data contain the details of expenditure incurred by a DDO during a financial year with Gross and Net amount of each voucher and is structured with a uniform and unique coding pattern for each Grant, Treasury, DDO, Major Head, Sub-Major Head, Minor Head, Sub-Head, Detailed Head, Object Head and Voucher Type. All the data fields of the VLC data are inter-linked to each other and the same could be easily used for analysis under different audit parameters by preparing a Business Intelligence (BI) Model. AG (G&SSA) Odisha initially prepared a BI Model using Qlikview for preparation of Annual Audit Plan for the year 2015-16. The BI Model so prepared presented different type of analysis in the form of charts by clicking the required field as given below:
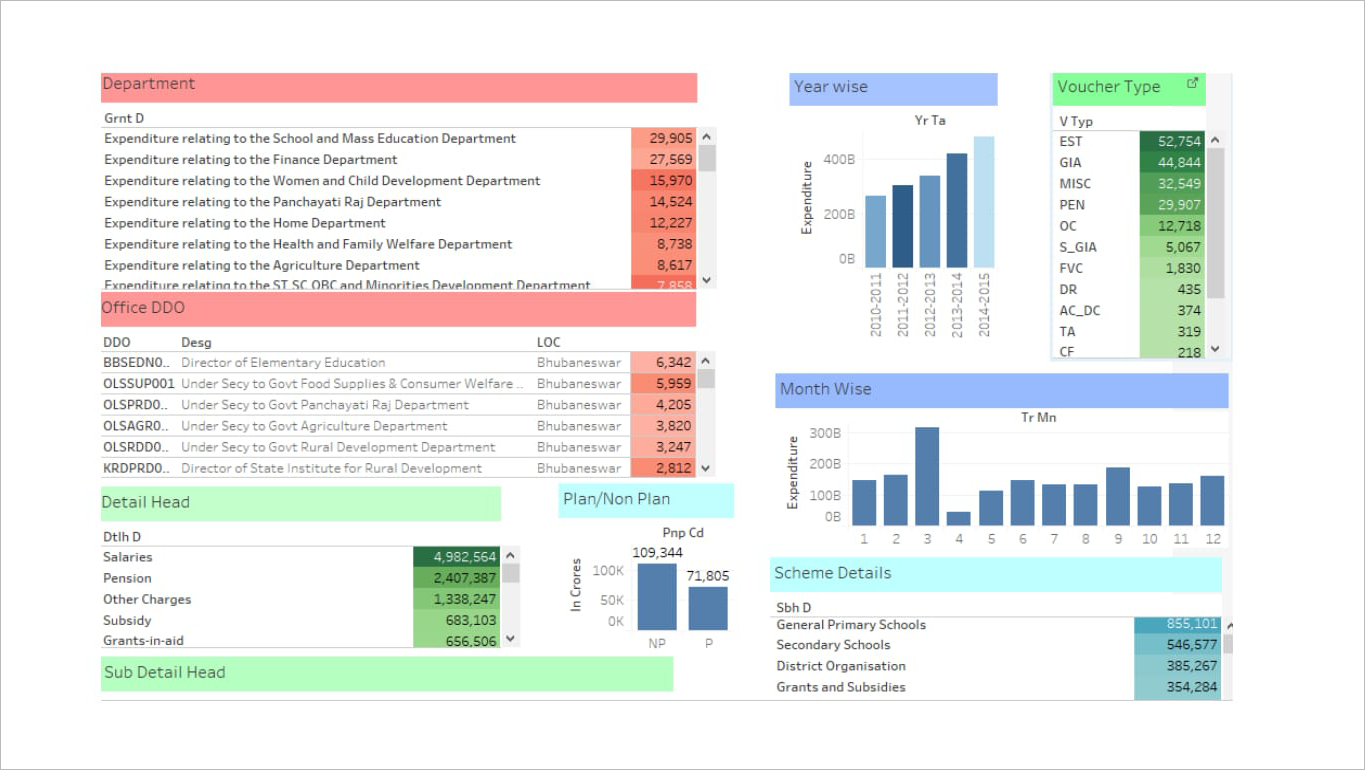
10. The BI model was later recreated in another tool viz Tableau as per the advice of Centre for Data Management and Analytics (CDMA).However, tools like KNIME and SQL were also used for joining different type of databases. The model is prepared to analyze the VLC data using certain audit parameters such as year-wise, month-wise, scheme-wise, department-wise and DDO-wise expenditure in order to utilise the same for audit planning and to identify risk area. The extraction of database under each of these parameters can be further filtered using criteria like plan, non-plan, object head, detailed head etc. As it is an interactive model, the selection of a record will reflect its corresponding expenditure under each of the parameter by hiding all other records which are not related to the selected record. For example, the selection of the record “Expenditure relating to the Finance Department” will present only the data relating to the Finance Department under each of the parameter mentioned above. Such extraction of data can be further filtered on the basis of the specific requirement such as expenditure relating to a particular year(s) or scheme(s) etc.
11. The BI Model prepared using the VLC data for the years 2010-11 to 2015-16 provided appropriate mechanism for selection of Apex /Audit units while preparing the Annual Audit Plan of the office for 2017-18. The best possible financial risk assessment was done using this model. Further sample selections for Performance, Thematic and Compliance Audits were also made based on BI model which provided expenditure details of all the 8244 DDOs present under GoO to carry out its functions.
12. The BI model was also uploaded in the laptops of the officers posted in the field parties for on-line assistance in order to have overall perspective on the financial performance of the Audit unit or Implementing unit from which the physical performance of the unit could be assessed. The model was also updated with certain modifications suggested by the Headquarters by employing the data on Receipts, Grants-in-aid, Works Accounts, Forest Accounts, Contingency Fund, Public Accounts and Budget. The group also prepared a video tutorial on the BI Model which was circulated by CDMA to all other IA&AD offices for replication.
13. The feedback received from the field parties indicated that the model has facilitated in highlighting the discrepancies in expenditure shown in compiled accounts from that of entity’s cash book. It also facilitated identification of high value expenditure of the audit unit for detailed examination and as a result a Draft Paragraph (DP) was also proposed. The reason for keeping Government money away from treasury accounts and utilisation of the same were reported in the respective Inspection Reports. The model has some limitation as the VLC data are generated only from the budgeted funds drawn by DDOs through the treasuries. Therefore, the model cannot exhibit and analyse the expenditure which are not routed through the treasury. The DDOs also receive funds directly as grants from GoI and GoO for implementation of various schemes which are not covered in the model.
Geographical Information System for Audit Management
14. Geographic Information System (GIS) is an integration tool for capturing, storing, checking, and displaying data related to geo-spatial jurisdictions in maps. Using GIS, audit could analyse data under different audit parameters to discover how they relate to each other with reference to the State, District, Block and Gram Panchayat (G.P) boundaries. The Data Analysis Group acquired maps of geographical jurisdiction for the state of Odisha from Odisha Remote Sensing Application Centre (ORSAC) and a team of officials were trained to analyse data using GIS. Once all of the desired data have been entered into a GIS system, they can be combined to produce a wide variety of individual maps based on different layers of audit parameters. The following are the examples of GIS use in audit:
15. In October 2013 cyclone “Phailin” hit Odisha and severely impacted the districts of Ganjam, Puriand Khordha. A scheme for disaster resilient houses to affected people is being taken up under Odisha Disaster Recovery Project (ODRP) in the villages within 5 km from the High Tide Line (HTL) of Sea as well as Chilika Lake in Ganjamand Khordha Districts of Odisha. A GIS analysis to ascertain the beneficiary villages within the 5 km from the High Tide Line (HTL) of Sea and Chilika Lake were done and shown below:
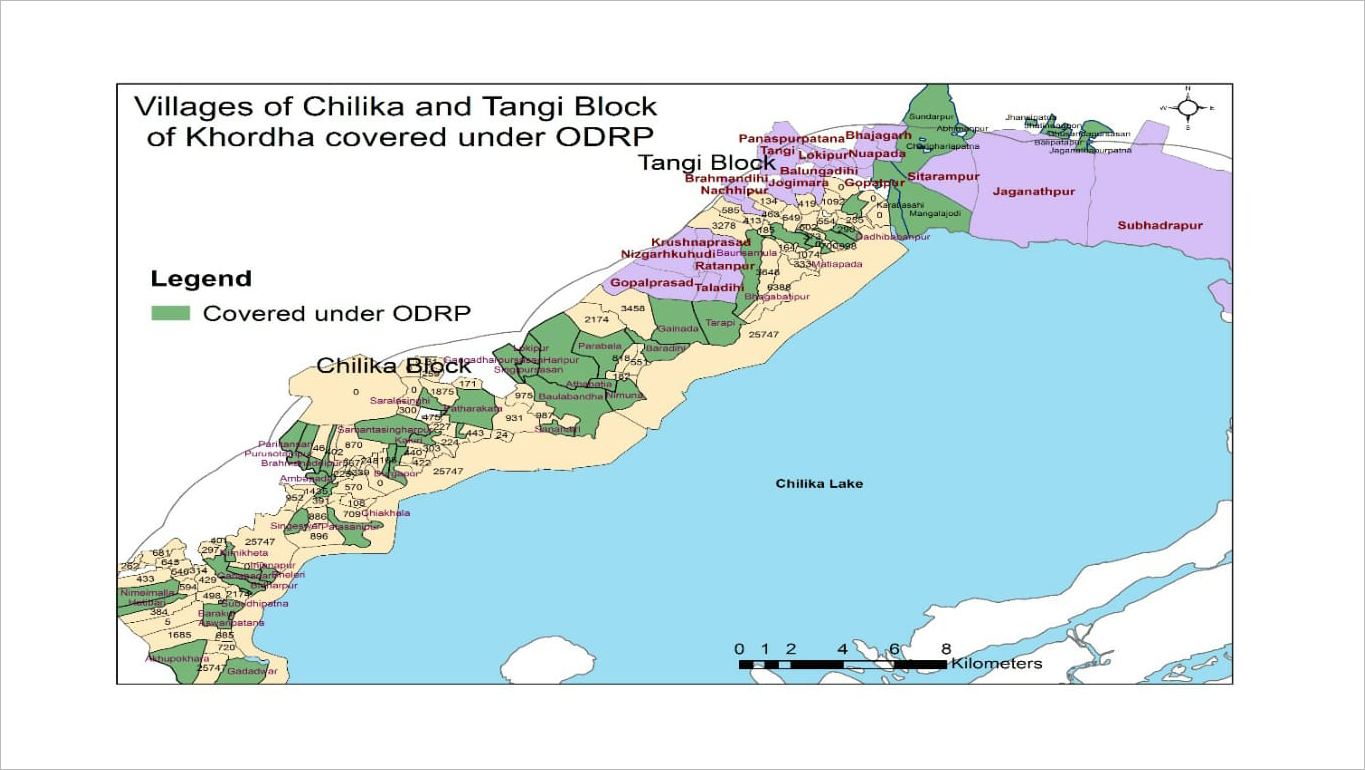
16. For instance, GIS analysis for Khordha district was done and it was observed that some villages which are beyond 5 km from the coast line is covered ignoring some villages within the proximity of 5 km from the coast line. The information was sent to the field parties and deviations were observed in the field audit.
17. The Government of India has initiated the National Cyclone Risk Mitigation Project (NCRMP) with a view to address cyclone risks in the country and identified Odisha as Higher vulnerability state. Under the scheme Multi-purpose Cyclone Shelters (MCS) are to be constructed within the 10 km from the High Tide Line (HTL) of Sea as well as Chilika Lake in the entire state. The GIS map plotting the data on MCS constructed in the State under the scheme is given below:
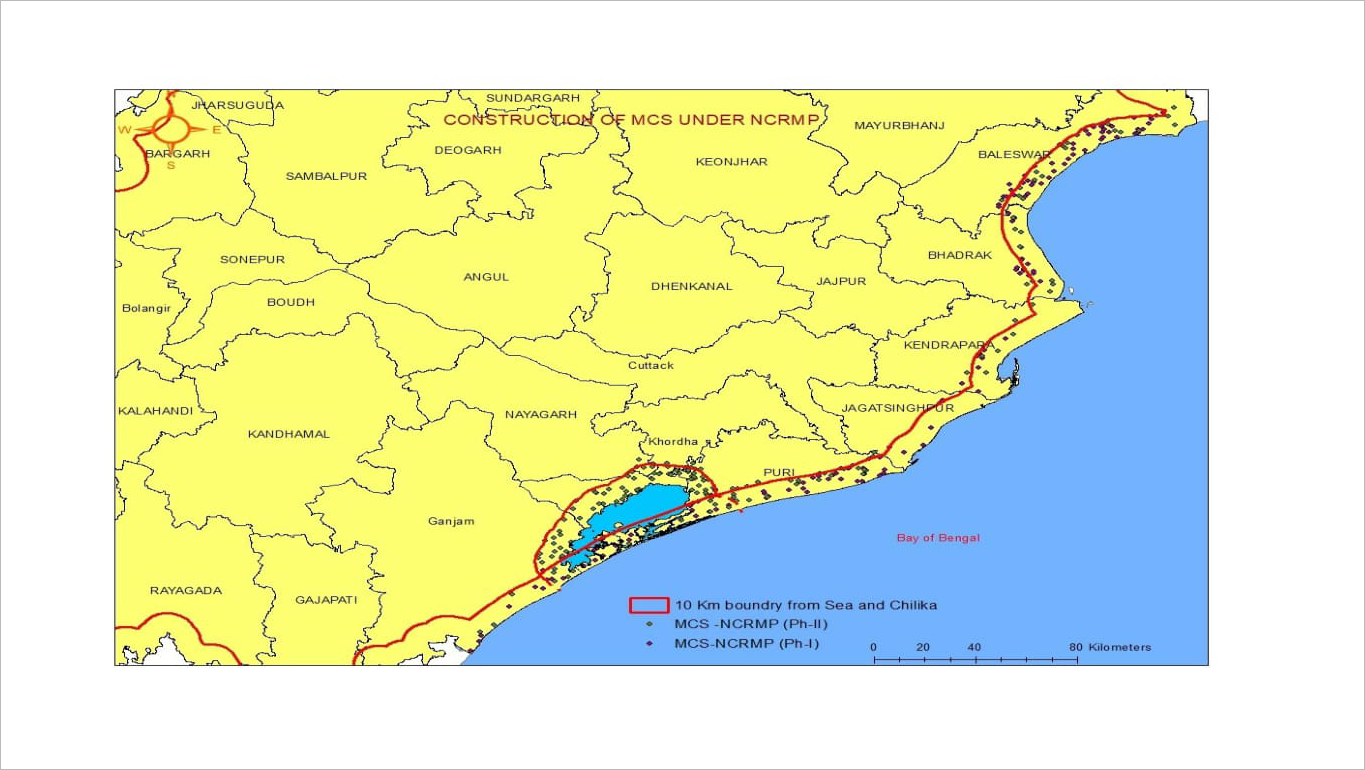
18. The GIS map indicates that 21 out of 295 MCS are constructed beyond the 10 km. The distribution of MCSs around Chilika lake in Ganjam, Khordha, Puri and Balasore districts were found to be dense whereas in Jagatsinghpur (6) and Kendrapara (15) districts, these were scattered even though these districts were worst affected during 1999 Super Cyclone. The field parties are advised to examine the reasons.
19. Standardisation of Audit Procedure: This office has developed a web based application with unit specific formats for capturing data on important Sustainable Development Goals (SDG) during compliance audits of Local Bodies and other implementing units. This has been successfully piloted and the data collected would provide appropriate measures of achievement against the most critical SDGs which are of public importance. On consolidation of data on SDG, over a year or two, the levels of sufficiency under each goal could be easily assessed.
20. Conclusion: Data analytics is an integral part of audit process having great potential to improve the efficiency and effectiveness of audit personnel. In addition, appropriate methods of financial risk assessment using data analytics during the audit planning and execution would minimise the failure of audit and improve the quality of audit products. Office of AG (G&SSA) has adopted these techniques and got the desired results in terms of improved quality audit products.
|