Data Analytics in Audit – Concept and Approach
By Shri Neelesh Kumar Sah, Principal Director, Centre for Data Management and Analytics
Public audit plays a crucial role in providing assurance on the delivery of public services to the people of a country.It derives its mandate from the basic documents guiding the country’s governance – the constitution of the country and the like. In fact, this is probably the only systemic arrangement for carrying out the function.
Citizens have multifarious requirements and expectations from the government. And thus the goals and objectives of the governments are that to serve the needs of their people. The governments have over time spread themselves out to deal with all possible requirements of its citizen. It works through various forms of governance, within government, outside government or partnerships between government and non-government entities.
 Not till around two decades back, the primary mode of record keeping in the government had been the paper based record keeping. Since the advent of computers, and corresponding developments in database management systems, storage, networking and software applications, the digitisation and automation of various government functions started happening. Though slow to pick up, the pace of digitisation has picked up in recent times tremendously. This coupled with the workflow automation would lead to a situation where the information available in the government would be only in digital form and in real time. Auditors need to be aware of such developments as far as the availability of information is concerned.
Another aspect and the more important one that faces them is the utilisation of the electronic data available. The analysis of this data is going to assist the Auditor in identifying appropriate audit findings and making meaningful recommendations. The multitude of readily available huge datasets along with the interlinkages among themselves presents another opportunity to the Auditors to provide holistic and balanced interpretations by exploiting what is generally termed as the (big) data analytics.
Data Analytics
Data Analytics has emerged as a major phenomenon in the last few years riding on the wave of data becoming available. This has combined various techniques and use of tools to gain insights from datasets, hitherto, unknown till now.
What is data analytics?
Auditors have been using data analysis to derive meaning or identify exceptions to the rules. However, data analytics approaches enable them to do more than just to identify exceptions or describe the data.
Data Analytics may be defined as the science of examining raw data with the purpose of drawing conclusions about that information. And this would involve the discovery, interpretation, and communication of meaningful patterns in data.
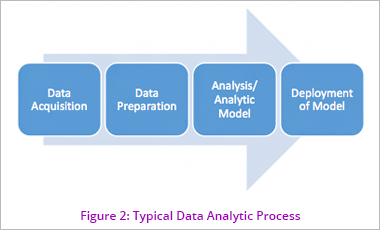
 As a process, data analytics encompasses the process of accessing data, extracting data, preparing the data, using the data for analytics, carrying out various analysis to discover and interpret the patterns and relationships in the data.
The above two dimensions of data analytics are, thus, related to techniques and tools, respectively. It will be important to understand the gamut of techniques and tools to make full use of data analytics by Auditors.
Techniques for data analytics
Data is presentation of facts or events in a numeric or representational form. Historically, the main forms of data to be analysed have been in numeric form. The text and image data (information) has been analysed manually. So have the audio or video data been analysed manually. Digitalisation has, now, made it possible to convert all kinds of information, text, image, video or audio, apart from the numerical data to be datafied1 , i.e., represented through a set of numerical dataset. This makes it possible to analyse and draw insights not only from numerical data but also text, image, audio and video datasets.
The basic feature for analytics, as can be seen from above is that the data is still converted into a numerical form or a numerical dataset. It thus is important to first discuss the techniques that are applicable for analysis of the numeric datasets.
Statistics is the science of dealing with numeric data – collection, analysis, presentation and interpretation. It is also used to estimate about a population by analysis of a sample dataset drawn from the population. It is defined by dictionaries as “a branch of mathematics dealing with the collection, analysis, interpretation, and presentation of masses of numerical data”2. Statistics thus forms the basis of the analytical approaches applied on any set of data.
Statistical Techniques
The most basic of the statistical techniques would be representing data in a simple tabular form and finding measures of central tendencies, viz, mean, median and mode. While interpreting the central tendencies, it is also important to have a measure of the spread or variance in the dataset, viz., standard deviation, variance, range, quartiles etc. These two measures are descriptive measures which describe the behaviour of the dataset and allow the auditor to make an estimate of the population characteristic from analysis of a sample dataset. When described over a period of time or along a class or geographically, these present a trend.
Further, the dataset may have multiple variables or there could be multiple datasets with multiple variables. Statistical techniques of classification, clustering, correlation and regression are useful in determining the relationship between the datasets or variables among the datasets. The same could further be studied over a period of time, along a class or geographically presenting a trend and pattern of behaviour.
Visualisation Techniques
The results of statistical analysis can be better appreciated when they are visually presented. With the tools available today, visualisation in different forms is possible. Some of the visualisation techniques are the scatter plots, line plots, box plots, pie charts, vector plots, polar plots, bubble plots, heat maps etc.
Analysing Unstructured Data
Unstructured data3 is mainly available to auditors in the form of text data, like the reports, documents etc, image data like the GIS imagery etc, audio and video data.
 Text data could be analysed from the information contained in the text. The information needs to be tabulated in order to make an analysis. The most common approach for such analysis is to count the repetition of some relevant key words. These can be populated as a word cloud that can highlight the most important word or even phrase. The respective documents could also then be identified and referred to, if required.
The GIS imagery can be used for data analytics by linking up the transaction data with the satellite images of a particular region. There are tools available which assist in carrying out the linkage and analytics. It is very useful not only in geographical layout, it is also useful in understanding temporal behaviour as images for different periods are available.
The audio and video data can also be datafied and analysed. This may be useful for Auditors during the audit processes of interviewing or creating evidence during physical inspections.However, their utility has to be established through some use-cases.
Tools for Data Analytics
The data analytic process involves access to the datasets, extraction of datasets, preparation of the datasets, applying data analytic techniques and storing of the datasets and the results. An approach also involves creating data analytic models for specific datasets that make them usable over time.
Thus the tools required for data analytics should be able to provide for these activities to be carried out.
Access
The access to databases may be as per any of the modes shown in figure 1 above. The tools should have the capacity to be able to access the datasets through any of these modes. Most tools available today are capable to access data through any of the modes available.
Extraction
The distinction between access and extraction needs to be understood wherein the extraction of data/ datasets means identifying and obtaining the relevant datasets for the purpose of analytics, whereas the access would refer to the access to the complete database from the auditee and also involves the physical transfer of the datasets from the auditee to the auditor’s environment. The stage of extraction requires understanding of the datasets to identify the relevant datasets from the databases accessed and then extract them in the auditor’s environment. This stage requires the data environment to be created at the auditor’s end to be able to read the database. Further, the relevant datasets are extracted from the database by running appropriate queries. Most tools have connectors available to link to different database environments.
Preparation
While the extraction phase involves extracting the relevant datasets, the dataset may not be ready to be subjected to analysis as it may have missing values, null values, zero values, duplicates, gaps or outliers. These have the impact of distorting the picture derived from the data analysis. Further, there may be requirements to add two datasets through join or by appending them or even to split the dataset into two or more sets, as required. Undertaking activities to address the data deficiencies or to add or split datasets is what is called data preparation.
Most tools have the features available to undertake data preparation. What may, however, distinguish one from the other will be in terms of the data sizes that a tool is able to handle. Else, the data preparation activity may involve a lot of time.
Applying data analytic techniques
The techniques described in the previous section are applied on the datasets through the use of algorithms built into the modern day analytic tools. It is the detail to which the tools have the capability to analyse that may distinguish them. Further, the need for writing codes or availability of the GUI4 utility may be another factor distinguishing a tool. While there are quite a few licensed tools available, many of the data analytic tools today are available as open source tools. It is for the auditor to decide on the usefulness of the tools keeping in mind the security of the data being handled through the tools as well as the sustainability, if the data analytic results are to be used repeatedly.
Data Repository
Data Analytic tools basically provide the capacity to access and read datasets from different sources, preparation and the analytic utilities. While having capacity to hold small data sizes, they cannot hold huge datasets, which are accessed from a data storage site or a data repository during data analysis. Thus, an effective data repository for the datasets accessed by the auditors and the data analytic results, so as to be readily accessed when required is essential. Maintaining the metadata5 of the datasets and the data analytic results has the potential to build up an information repository that makes the use of the repository effectively for data analytics. The repository may be used to disseminate adequate information to different levels of users in the audit organisation.
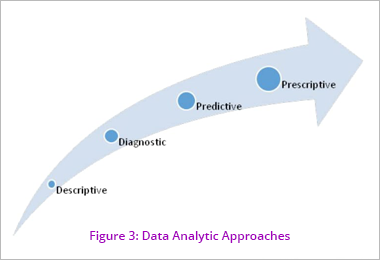
Data Analytic Approaches
Based on the analytic techniques available, the data analytic approaches could be descriptive, diagnostic, predictive or prescriptive.
The descriptive and diagnostic approaches would use the descriptive techniques mostly while the predictive and prescriptive techniques would also use the correlation and regression techniques which establish relationship between variables and predict the behaviour of one variable based on the changes in the other set of variables.
Auditors would predominantly use the descriptive and the diagnostic approaches but may use predictive approach and in times to come, supported by a good data repository, prescriptive approach.
Usage of Data Analytics in Audit
The data analytics may be used in any of the stages of Audit – audit planning, audit execution, reporting. But, as can be clearly seen from the above discourse on use of techniques and tools, data analytics is useful in drawing insights on the datasets. This makes data analytics useful for the audit planning phase. Audit planning involves setting of audit objectives, scope, methodology for audits. The insights on datasets can be used to decide on all of these. During the audit execution stage, data analytics can be useful in identifying exceptions, drilling down etc. At the reporting stage the data analytic results and the conclusions drawn from the audit process may be reported using appropriate visualisation techniques.
The patterns from the data analytics become important for auditors from the fact that trends and patterns have the potential of identifying unusual events, even though no rules are broken. Use of GIS tools enhance such appreciation.
Data Analytic Models
Auditors have a responsibility to report on the assurance of the governance systems periodically. The issues under audits may be revisited periodically. Further, the datasets would be available every year and in times to come, may be even, real time. As such, the set of analytics could be applied on the datasets repeatedly, if the format of the datasets does not undergo a change and a periodic access to the datasets is ensured. Thus, the set of analytics applied on a dataset in a data analytic process may be repeated when the data is updated. As such, there is a need and it is possible as well to create models out of one data analytic efforts, if the same is well documented and the data analytic schema and results are adequately stored in data repository.
Audit is set to gain tremendously if the repeatable models on data analytics are developed and, in time, lead to repositories on different facets of governance.
Conclusion
Data analytics has the potential to assist the Auditor in discharging his crucial role in providing assurance on the delivery of public services to the people of a country.It helps him in drawing insights and relevant conclusions about large and complex functions carried out by government and its agencies.It assists him in deriving all relevant insights from the available information making the process of the audit more efficient and effective.
Knowledge of data analytic process and techniques would play a crucial role in equipping the Auditor to deal with the intricacies present in datasets available. The government functions are digitalised at a fast pace. Auditors should, therefore, necessarily, ensure that they keep pace with the developments and possibilities available in the data analytics domain.
1. Datafication may be defined as the process of conversion of an information into numeric form that can be subjected to data analysis.
2. https://en.wikipedia.org/wiki/Statistics
3. Unstructured data could also be numerical. However, it is generally possible to convert the numerical data in a structured format.
4. Graphical User Interface
5. Metadata – data that provides information about the data
|