An analysis of Inter-se share of tax devolution determined by 13th Finance Commission
By Shri K. S. G. Narayan, IA&AS, Principal Director (IT Audit), Office of the CAG of India, New Delhi
The setting up of a Finance Commission (FC) every five years is a constitutional mandate- the Finance Commission determines the resource sharing based on constitutional division of functions and finances between the Centre and the States. While this fact is known to all, few would be aware of the power enjoyed by this constitutional entity, and its impact on the finances of the States, which an analysis of the method following in deciding the relative share of the states indicates.
Any FC has to arrive at two key decisions – what should be the relative share of Centre and States in the net proceeds of Taxes, and what should be the relative share of each state vis-à-vis other states. In addition, the FC also recommends grants-in-aid to States, which because of its relatively lower amount, is not considered in this analysis.
The first decision of the FC- relative share of Centre and States, is not backed by any quantitative analysis, and is simply stipulated by the FC. The States share remains roughly in the region of 30 %, with the 13th FC providing 32% to the States. It is in the determination of inter-se share of the States that the FCs have exercised their discretion by constructing various quantitative models involving multiple parameters.
The 13th FC had used four parameters with differing weights in determining the inter-se share of States in tax devolution:
The share of each State after considering the impact of the four parameters is presented as a single number (in %) by the FC in its report (Table 8.2). The impact of individual parameter is not shown anywhere in the report.
All parameters, except Area, tend to population based share. That is, if the aspect being measured by a parameter (fiscal capacity or fiscal discipline) is the same for all States, then the share of each State is the same as its population based share. In some ways, population based share appears to be the most natural and just way of determining the share of each state, with each citizen getting the same per capita amount as his share of the shareable taxes. The earlier FCs recognized this aspect- the weight of population as a parameter in determining the relative share of States varied from 80% to 100 % in the awards of the first five FCs. Subsequent FCs introduced additional parameters, with gradual reduction in the weight of population.
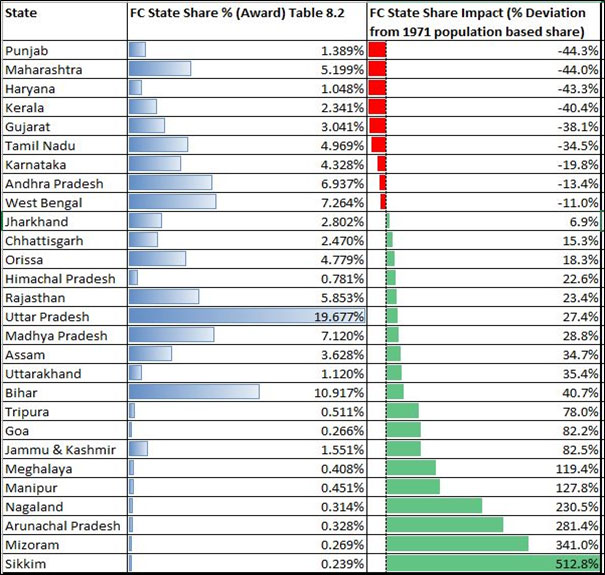
With all parameters tending to a population based share, a convenient measure to show the impact of the FC award on inter-se share of States is by representing it as % Deviation from its population based share. The 13th FC recommended inter-se share of States, along with its representation as deviation from population based share is shown below:
While the % share of each State varies in a fairly narrow range- from 0.239 % for Sikkim to a high of 19.677% in case of Uttar Pradesh, the same share when presented as deviation from population based share shows a wide variation, varying from (-)44% in case of Maharashtra to +513% in case of Sikkim. The true impact of FC award, and the application of its discretion in arriving at the share of each state is visible only when displayed in this manner. This may be one reason why we do not hear loud protests from states like Maharashtra, Gujarat and Kerala which lose a significant share of their population based share of taxes. FC should display the States' share using the above measure to make it better understood by all stakeholders.
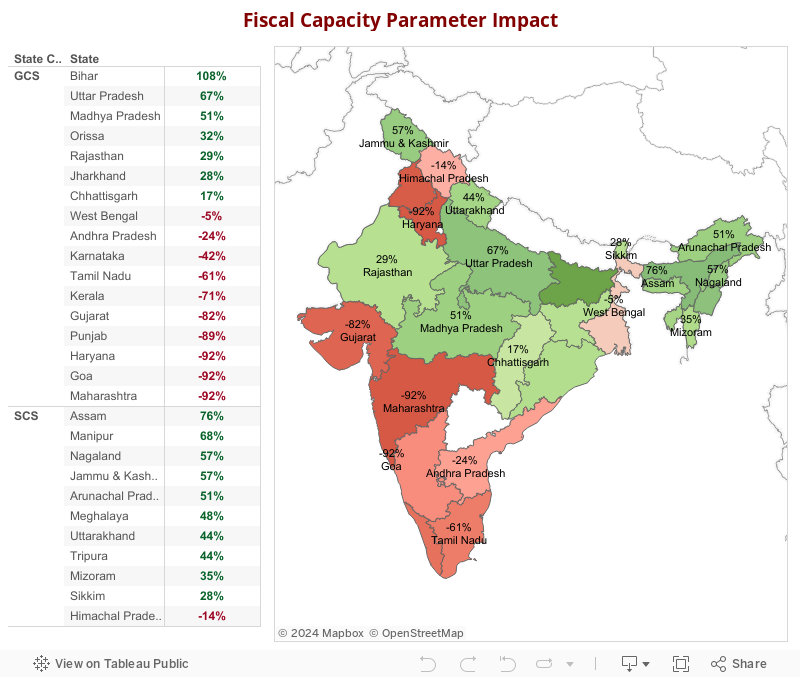
The Fiscal Capacity Distance parameter had the highest weight at 47.5 %. This parameter has the largest redistributive impact, as assessed by its impact on the change from population based share. The impact in terms of deviation from population based share varies from -92% (Maharashtra, Goa, Haryana) to +108% (Bihar). The parameter addresses the need for equity component in determination of relative fiscal need. FC 13 has said in its report: "The intent of the equity component in the devolution formula is to ensure that all states have the fiscal potential to provide comparable levels of public services to their residents, at reasonably comparable levels of taxation".
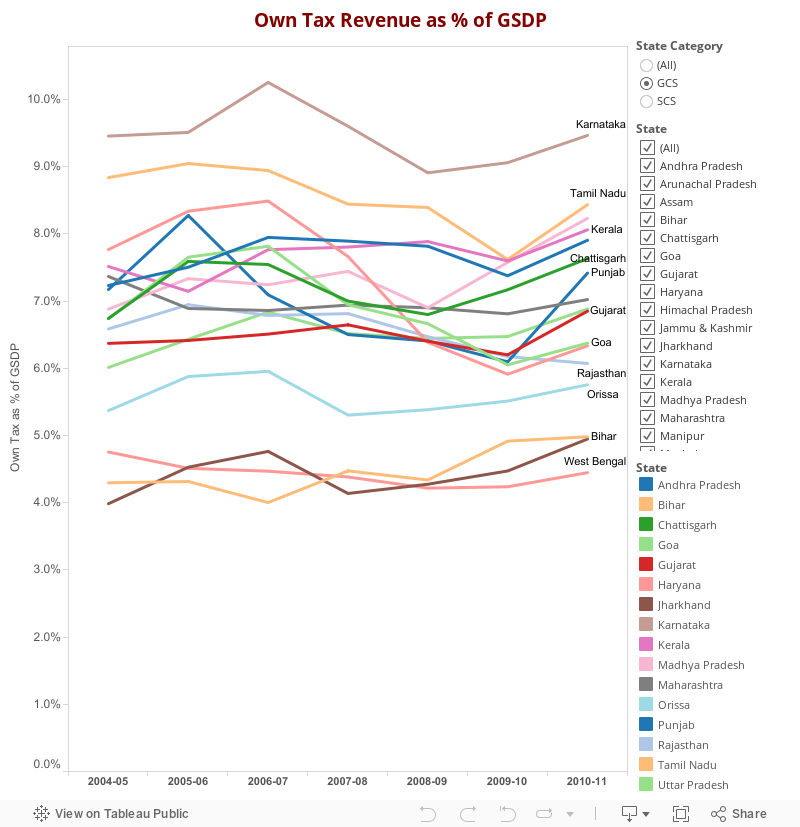
To compute the fiscal capacity distance, a uniform Tax to GSDP ratio has been taken separately for general category and special category states. FC 13 has stated that "Ideally, tax frontiers specific to each state should be estimated, but an exercise of this kind was constrained due to lack of the necessary data". By taking a single Tax to GSDP ratio for all states within a category (GC or SC), the fiscal capacity distance parameter, which was meant to promote equity, penalizes states which have a lower Tax to GSDP ratio (Bihar, Jharkhand, West Bengal at less than 5%) and benefits states with higher Tax to GSDP ratio (Tamilnadu, Karnataka at over 9%). This happens because fiscal distance is computed from the assumed fixed Tax to GSDP ratio, which is different from what is observed in the last 10 years, and what the state is likely to see in reality. The Tax to GSDP ratio remains relatively flat over a long period of time, as can be seen in the graph for GC States below.
If the ideal state of computing the tax frontier for each State cannot be reached, a more equitable process may be to assume a notional Tax to GSDP for each state which is in keeping with the past trend, adjusted marginally for performance that can be reasonably expected. If such an approach is followed, many of the higher GSDP states may no longer be in need of fund allocation from this parameter. The notional distance of ₹ 100 taken by FC 13 for three states dilutes the objective of equity which that parameter seeks to attain. The final impact of this parameter with the largest redistributive effect is best seen in the map chart (below), with the Red states representing the states getting less than their population based share, and the Green denoting the reverse.
Fiscal capacity model uses a linear distance model, which works fine in a situation of scarcity. But when funds available are in excess of that required for reaching equality, the distribution is no longer fair. For this reason, the weight assigned to this parameter needs to be back calculated by first determining the fund requirement for reaching fiscal capacity equality. FC 13 devolution was sufficient to reach fiscal capacity equalization objective. This is a remarkable achievement, and should have been given wide publicity, and prominently stated in the FC report. However, it is to be noted that FC does not have any specific mandate to target such redistribution. Canada, with a similar federal mechanism targets revenue equalization based on a 1982 constitutional amendment.
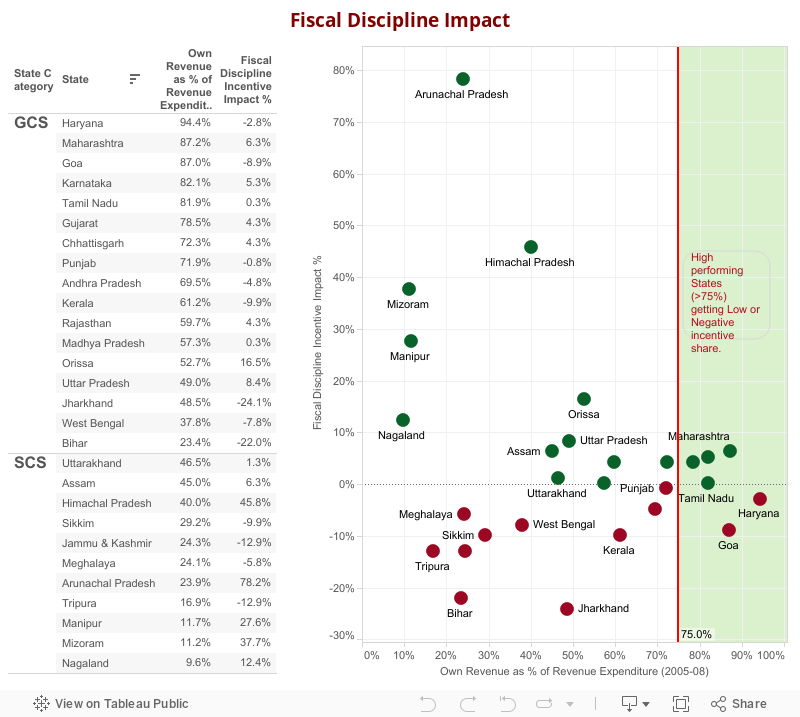
The Fiscal Discipline criteria with 17.5% weight is meant to serve as an incentive to States for managing their finances prudently.This incentive will have an impact only if the States know how well or badly they have performed. The FC 13 report does not separately show the impact of individual parameters. Fiscal discipline parameter is based on the ratio of Own Revenue Receipts of the States to its Revenue expenditure. However, the way this parameter is configured within the devolution criteria, the impact does not seem to be rewarding States with high performance in this parameter. As can be seen in the scatter plot, the high performing States (on the right, with high Own Revenue as % of Revenue expenditure) are actually showing a very small impact, with many also showing a negative impact.
The criteria also does not take into account the fact that there is possibly an upper limit to this parameter (near 100%) or that there is bound to be a catch-up effect which will taper off at some stage.
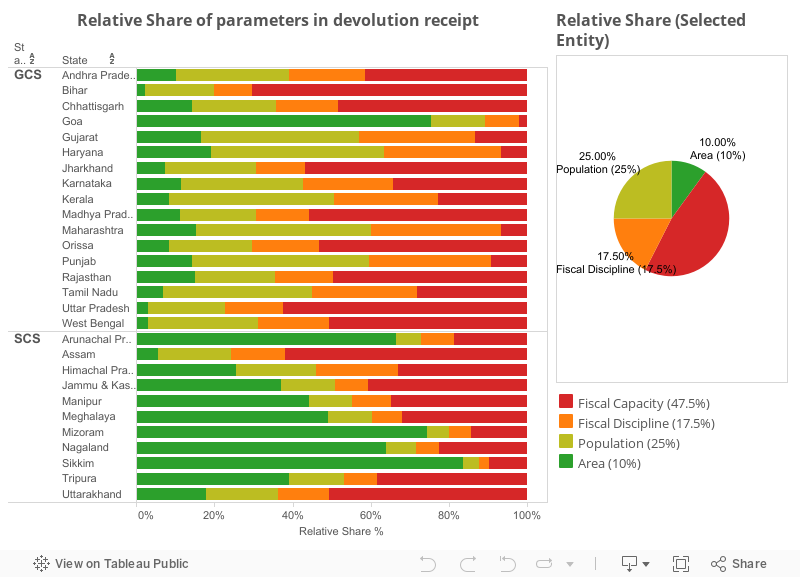
The final parameter, Area, has a weight of 10%. It uses a floor of 2% so as to ensure that smaller states get a minimum of 2% share from this parameter. The net impact is that for most of the Special Category states, this becomes the most important funding parameter, as can be seen in the graphic below showing the relative share of various parameters in a given State's share. It also leads to an anomalous situation where Goa, the richest state at the time of FC 13 award, gets 82% more than its population based share in the final award. FC needs to seriously consider revising the use of 2% floor in the Area parameter.
The above analysis was done using QlikView and Tableau Desktop software, the two leading Business Analytics tools which enable exploratory data analysis through data visualisation.
Continue Reading
XXVIIth Accountants General Conference, 2014
The biennial Conference of all senior officers (Accountant General/Principal Director level